Gallery
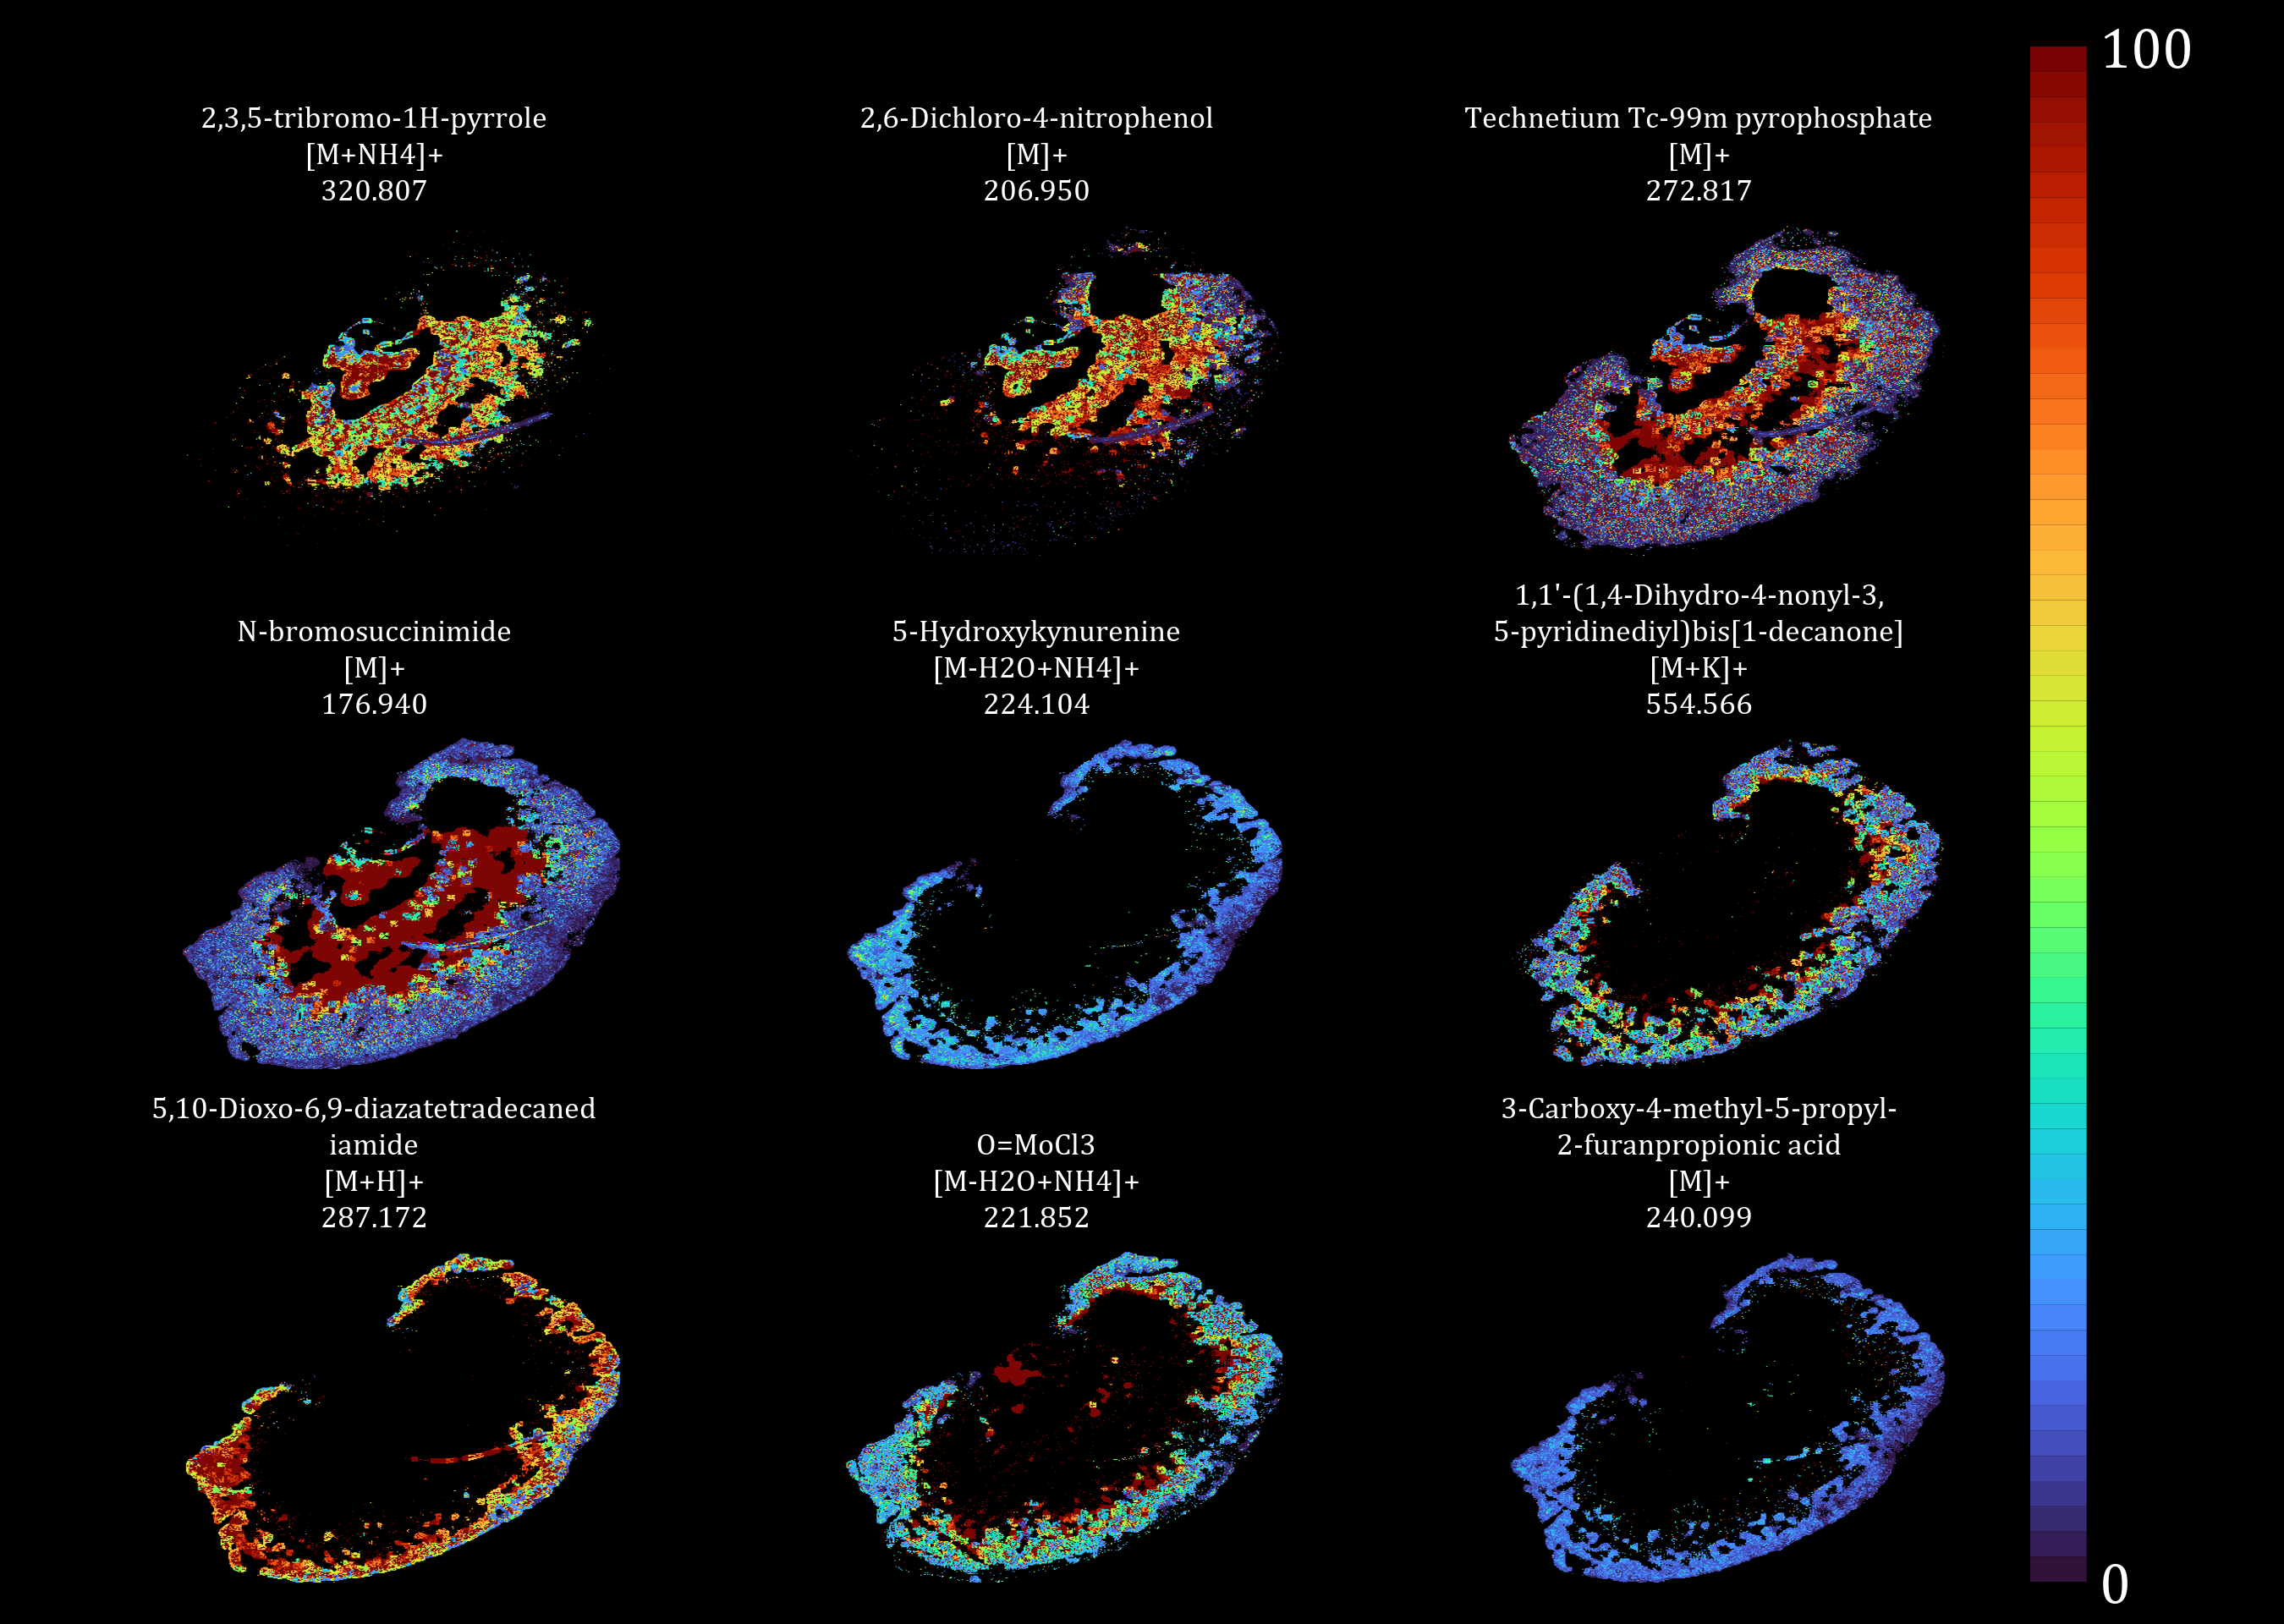
Kidney multiple ions ms-imaging
A mouse kidney ms-imaging from the PANOMIX lab, this ion matrix heatmap plot shows the spatial expression of 9 metabolites on the kidney tissue.
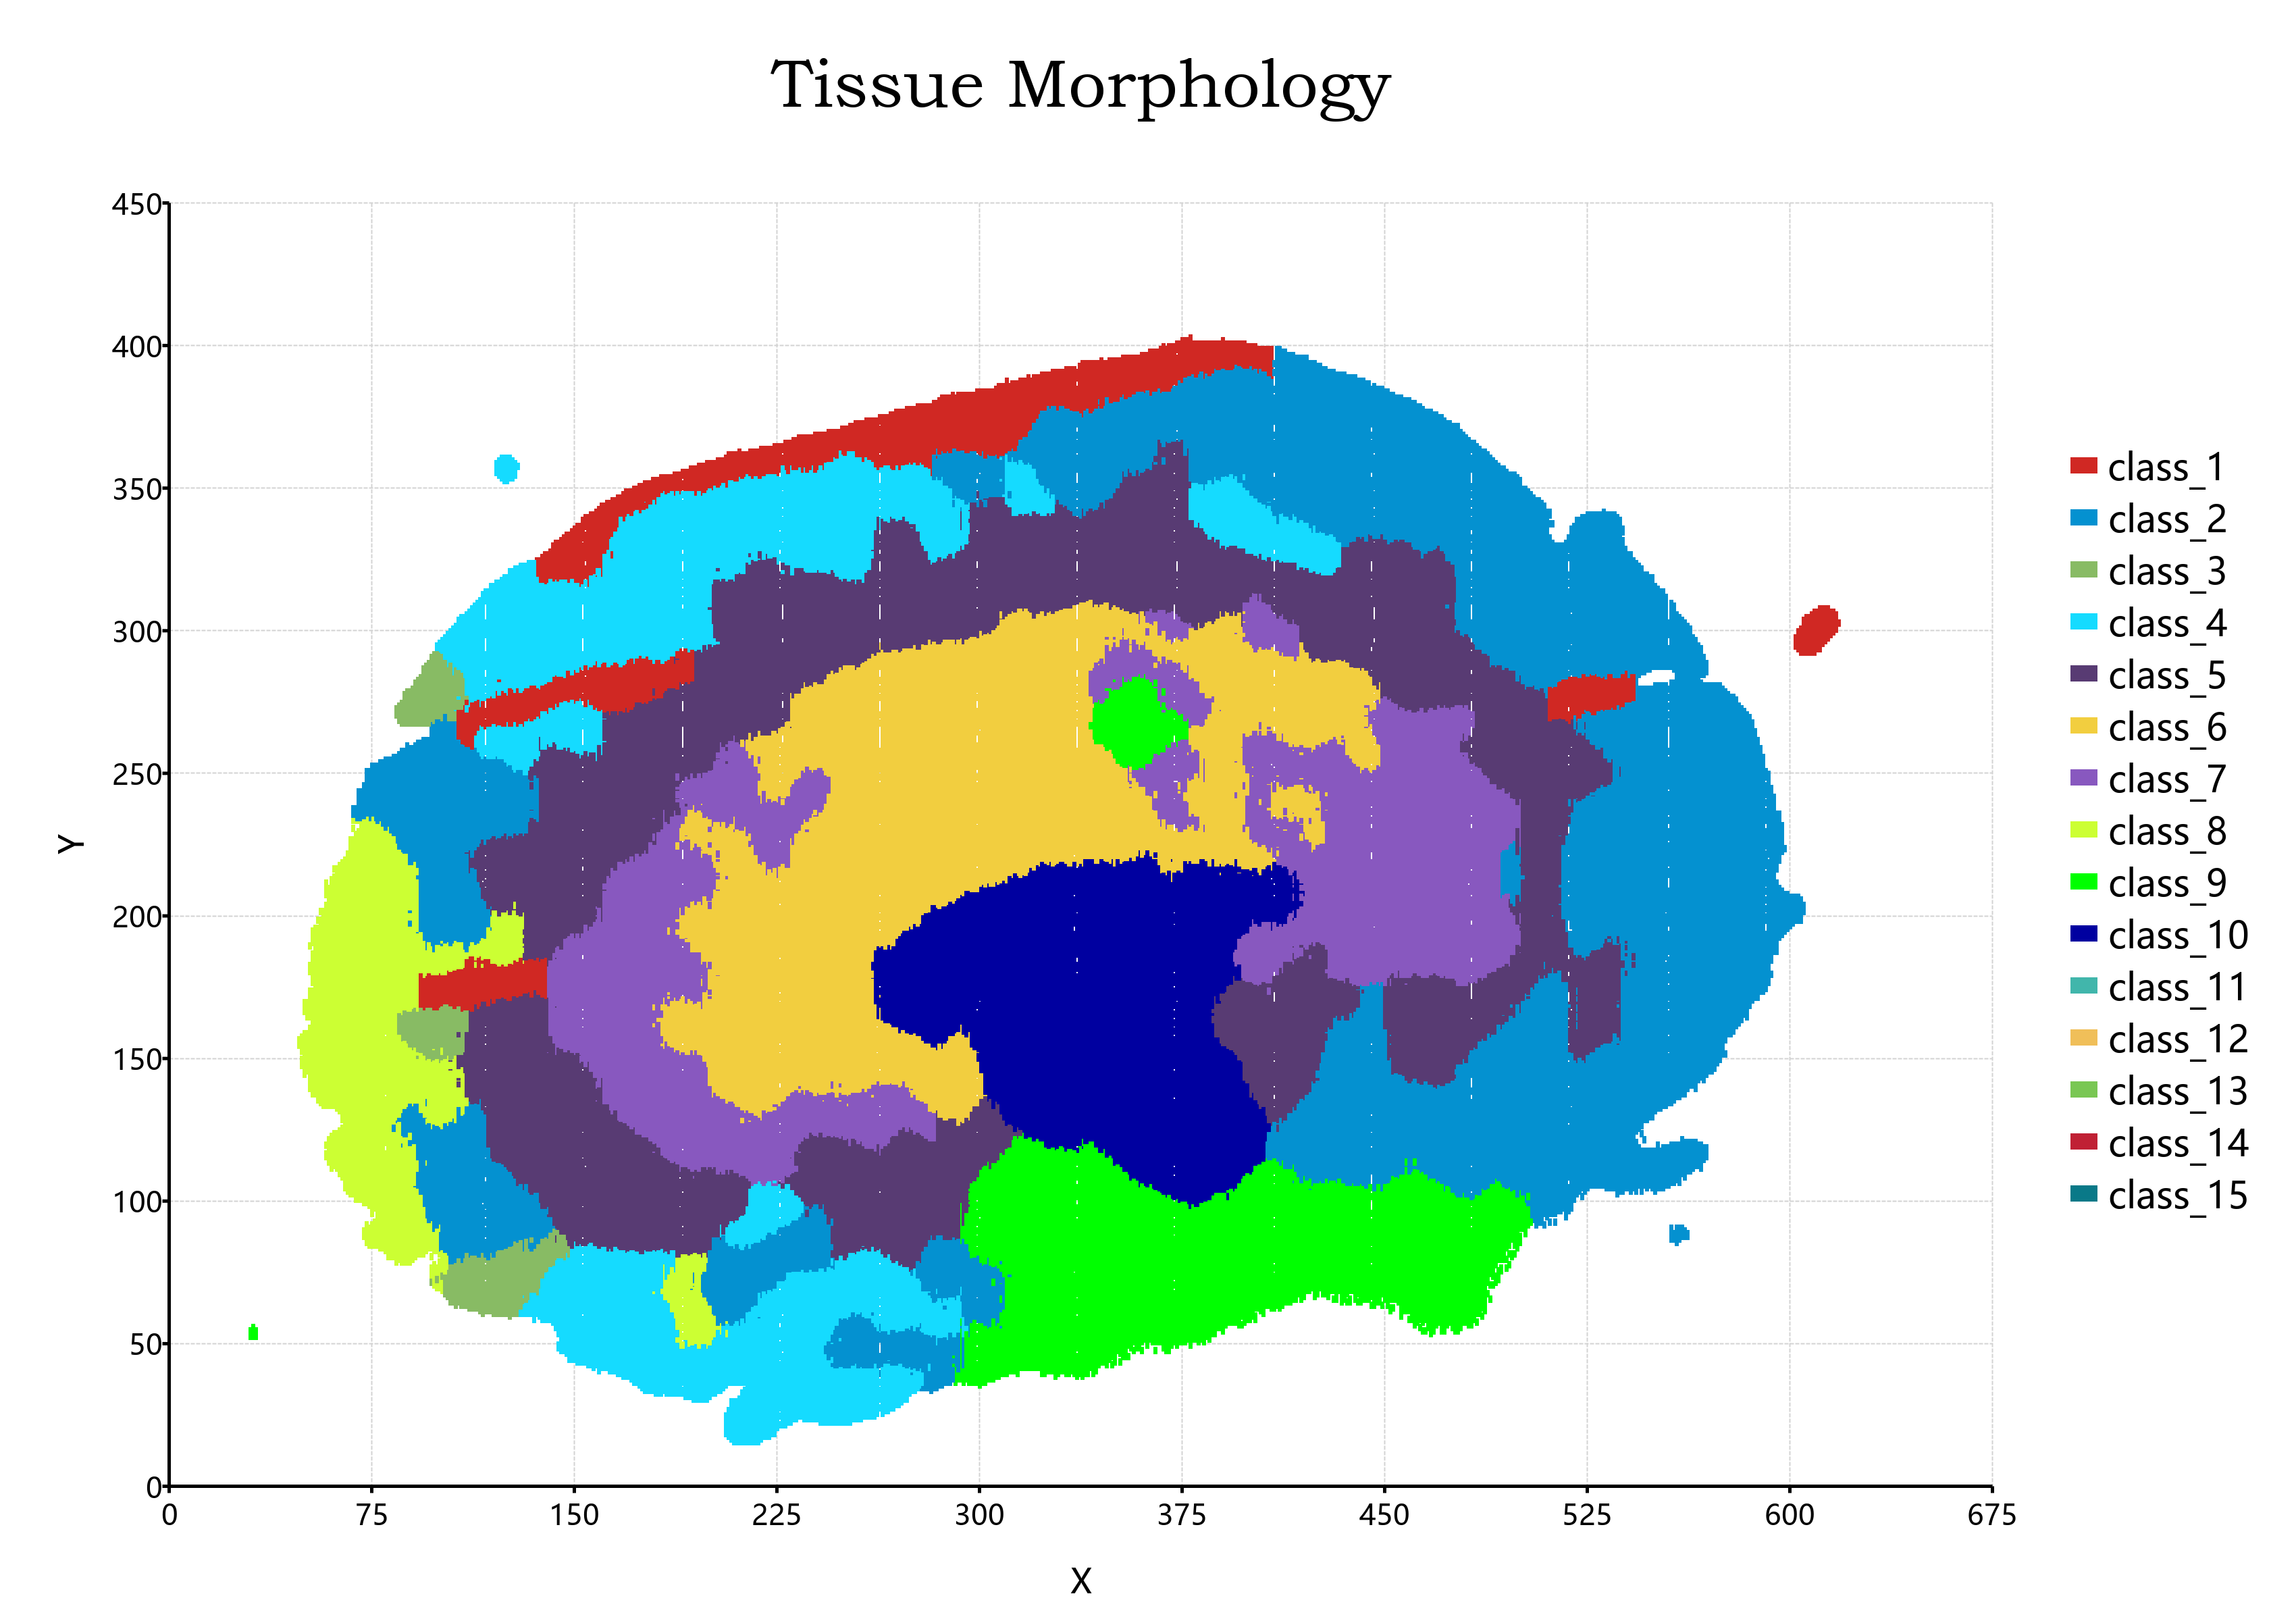
Spatial single cell metabolomics
Another mouse kidney single-cell ms-imaging tissue morphology result from the
PANOMIX BioDeep R&D lab.
The tissue was scan by the Thermofisher QE+ combine with the AP-MALDI ion source
to obtain the single-cell metabolomics data. The single cell raw data was
deconvolution to a high
dimensional cubic matrix and then do auto segmentation to obtain the tissue
regions.
Tissue region Class_7 is marked as a tumor region and
confirmed via the HE stain analysis.
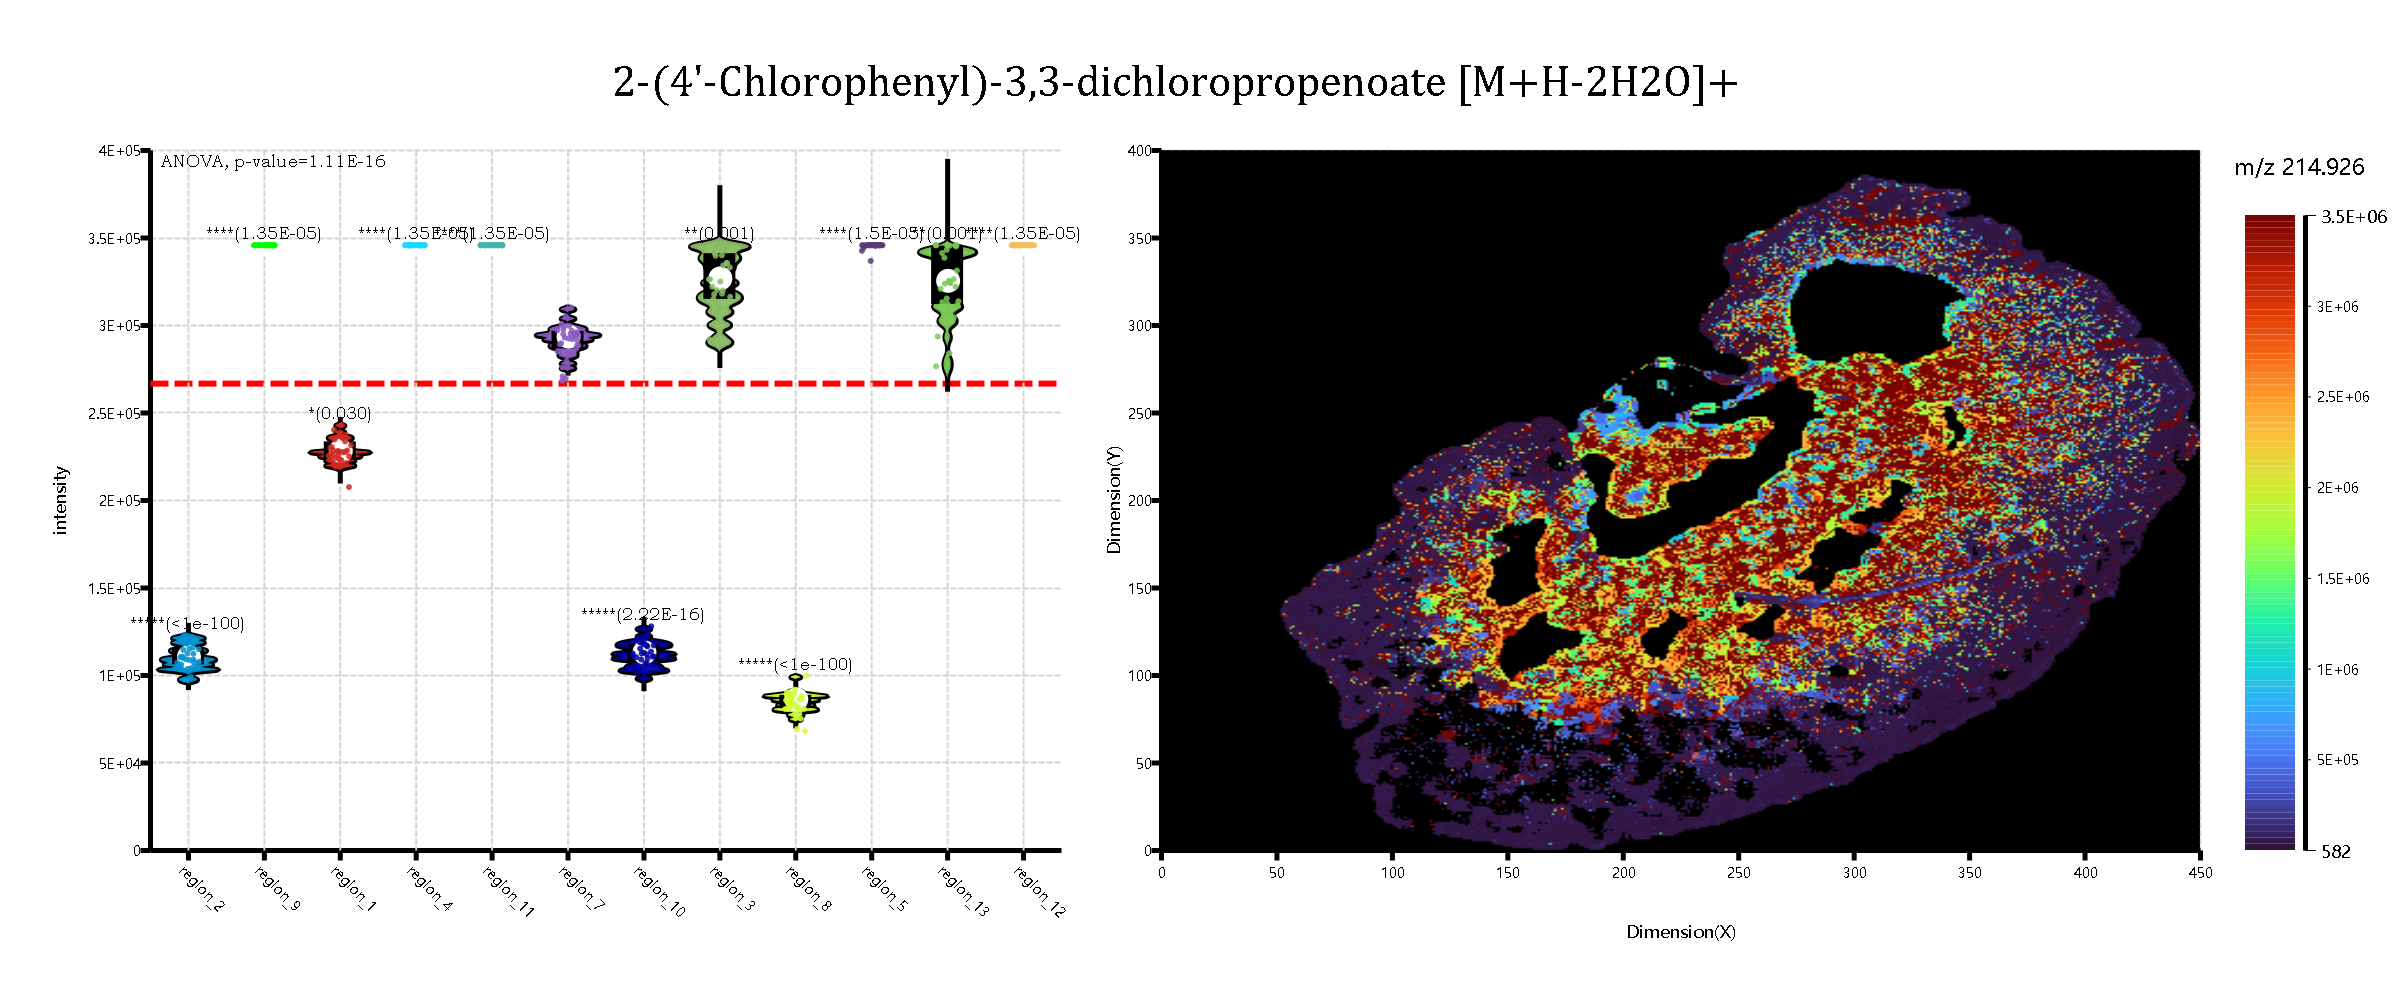
Multiple region stat plot
The sample data of each ions on the tissue specimen sample is sampling based on some specific statistics method, and then we apply the statistics analysis to found out the metabolite expression difference between each tissue regions which is extract from the single cell metabolomics data.